By David Nataf
26 September 2026 — Jerusalem
Jerusalem — Home prices in the Jerusalem district fell 0.4% in June–July 2026 compared with May–June, while the national index edged up 0.2%, according to the Central Bureau of Statistics (CBS) release published on 15 September 2026. Year on year, Jerusalem was still 1.1% higher, one of only two districts in positive territory. A new CBS quarterly index of second-hand homes recorded its steepest decline in Jerusalem: −2.9% in the second quarter of 2026 compared with the first.
What the CBS measured
The CBS Home Price Index compares quality-adjusted transaction prices over rolling two-month periods, using deals reported to the Israel Tax Authority. The latest reading covers June–July 2026. The bureau describes the figure as provisional, because some deals signed in the period have not yet been reported.
- Israel: +0.2% versus May–June; −1.2% versus June–July 2025.
- Jerusalem district: −0.4% versus May–June; +1.1% year on year.
- Tel Aviv district: +0.7%; −0.9% year on year.
- Central district: +0.3%; −3.2% year on year.
- Haifa: −0.3% (−2.4% year on year). North: −0.1% (+1.0%). South: +0.1% (−0.6%).
The district figures above are those of CBS release 292/2026 as reported by Israel National News and by the real-estate site Klika on 15 September. Globes, reporting the same release on 16 September, rounded Jerusalem’s annual change to 1%.
A new resale index — and Jerusalem leads the decline
With this release the CBS began publishing a separate quarterly index of second-hand home prices. According to Globes, it is published with a one-month delay so that the bureau can collect most of the quarter’s transactions from the Tax Authority. Nationally, resale prices fell 1.2% in the second quarter of 2026 compared with the first. Jerusalem fell 2.9%, Tel Aviv 2.0% and the Central district 1.1%, while the South (+0.3%), the North (+0.1%) and Haifa (+0.1%) posted small gains.
Globes noted that Jerusalem was the only district where second-hand homes fell faster than the district’s overall index in the quarter: the general index there declined 2.3% between the first and second quarters, against 2.9% for resale homes alone. Klika, citing the CBS release, reported that the resale index will now appear once a quarter — in March, June, September and December — to ensure a large enough number of transactions per district.
The recent path of Jerusalem prices
The June–July dip follows a volatile spring. In February–March 2026, Jerusalem district prices rose 0.4% and stood 4.2% above a year earlier, according to CBS figures reported by The Times of Israel. In March–April they fell 2.0% while remaining 1.7% higher year on year. In the May–June release, Jerusalem was among the districts that rose, Klika noted — before turning down again in June–July. Over those readings, the district’s annual gain narrowed from 4.2% to 1.1%.
Transaction-level data point in the same direction. WizBid, which aggregates deals reported to the Tax Authority, showed a two-year median of ₪34,756 per square metre across 12,180 Jerusalem apartment sales when consulted on 26 September 2026, with the median price per square metre down about 1.8% over the latest 12 months against the previous 12 (₪34,375 versus ₪35,000).
Rents keep moving the other way
Rents have not followed purchase prices. The CBS Housing Services Index, which includes rents, rose 0.7% between July and August and 3.6% over the 12 months to August 2026, against 1.5% for the overall Consumer Price Index (Globes). Tenants renewing a lease saw average increases of about 2.6%, and 4.4% where a new tenant replaced the previous one (Israel National News, citing the CBS). These rent figures are national.
In Jerusalem listings, Yad2 data published by Globes on 13 August showed average asking rents for three-room apartments in Beit HaKerem and Ramat Beit HaKerem at ₪6,524 a month in July 2026, up 17% from ₪5,576 a year earlier — the steepest annual rise among the neighborhoods Yad2 examined. Three-room asking rents in central Jerusalem rose 10.4%, or ₪745 a month, over the same period.
What the numbers do and do not say
- Provisional data. Two-month district changes are small and can reverse: Klika pointed out that the district picture in this release was almost the mirror image of the previous one.
- District, not street. The index covers the whole Jerusalem district and is quality-adjusted; neighborhoods such as Rehavia and Pisgat Zeev can move differently.
- New versus second-hand. Nationally, new-home prices rose 0.5% in June–July (0.4% excluding government-subsidised deals), and subsidised deals made up 41.2% of new-home transactions, up from 37.8% in May–June (Klika, citing the CBS).
Related data: neighborhood figures are compiled on our Jerusalem sale prices and Jerusalem rent prices pages.
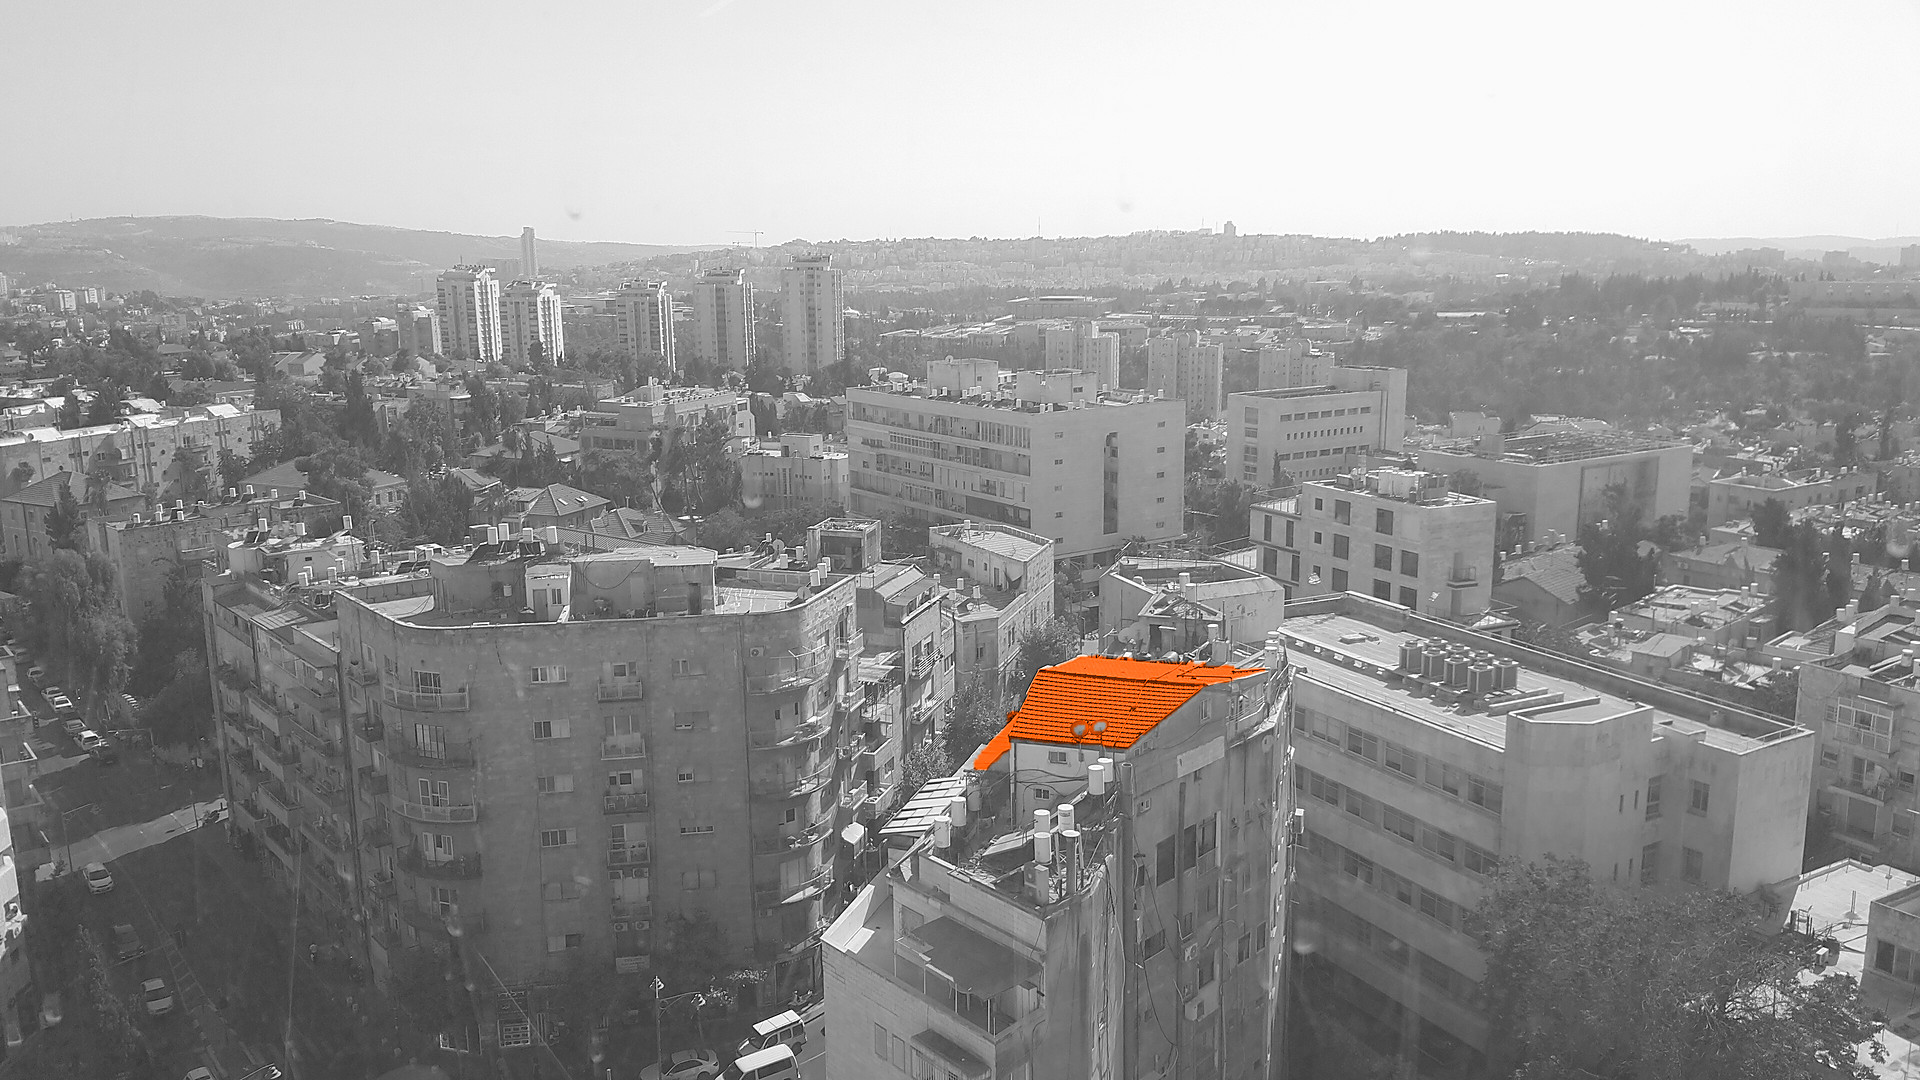
Featured image: Rehavia seen from the City Tower, Jerusalem. Photo: Yair Liberman, CC BY-SA 4.0, via Wikimedia Commons. Converted to black and white with one orange accent by Tel Aviv Apartment; the adapted image is shared under the same licence.
Sources
- Central Bureau of Statistics — Price changes in the dwellings market, release 292/2026 (15 Sept. 2026, Hebrew PDF)
- Globes — While home prices waver, rents are moving strongly upwards (16 Sept. 2026)
- Israel National News — Prices keep rising: what got more expensive, and what got cheaper? (15 Sept. 2026)
- Klika — Home price index June–July 2026, district table from CBS release 292/2026 (15 Sept. 2026, Hebrew)
- The Times of Israel — Housing snapshot May 2026 (February–March CBS data)
- The Times of Israel — Housing snapshot July 2026 (March–April CBS data)
- Globes — Yad2 data: the neighborhoods where rents jumped most (13 Aug. 2026, Hebrew)
- WizBid — Jerusalem apartment deals from Tax Authority records (consulted 26 Sept. 2026, Hebrew)
Leave a Reply